Troponin kinetics: why timing matters
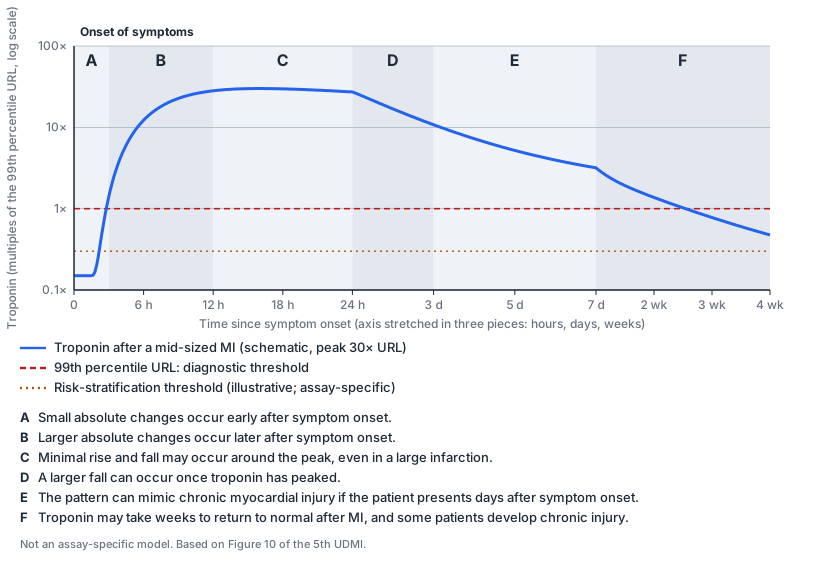
Slide the sampling time and interval to see how the size of a rise or fall depends on where you are on the curve (5th UDMI, Figure 10).
For learning only. This simulator shows why timing matters when you compare two troponin values. It uses a schematic curve, takes no patient data, and does not feed the ECG, test-characteristics, or classifier pages. For the biology behind the curve, see troponin biochemistry.
Scenarios (UDMI-5 Figure 10)
Samples on the steep part of the rise. Absolute and relative changes are large.
Simulated patient
Zone B: 3 to 12 hours
Time to second sample
Peak troponin
30.0× URL
Smaller infarcts peak lower; the scale is logarithmic.
Baseline before the event
Below the URL, as in most healthy people.
Release pattern
Peak about 16 hours after onset. Release kinetics differ with reperfusion and microvascular obstruction .
Time axis
Troponin after the infarct (schematic)
Circles 1 and 2 are your two samples. The red line is the 99th percentile URL; the dotted amber line is an illustrative, assay-specific risk-stratification threshold. Lettered bands are the zones A–F of Figure 10.
What these two samples show
| Sample | Time since onset | Zone | Troponin |
|---|---|---|---|
| 1 | 5 h | B | 8.06× URL (above) |
| 2 | 8 h | B | 19.8× URL (above) |
| Change from sample 1 to sample 2 | +11.7× URL (+145%) | ||
Rising: +145% (+11.7× URL). This exceeds the usual 20% relative-change cut and is consistent with acute injury. Remember that the 20% figure reflects assay imprecision, and near the URL absolute changes are more precise than relative ones; assay-specific absolute deltas apply.
How big is the change if you sample 3 hours apart?
Each point is the percent change between a sample at that time and one 3 h later. The shaded band is ±20%. The change is largest on the rise, near zero around the peak, and negative after it. Values beyond the plotted range are clipped.
Points from the 5th UDMI to take away
- Troponin becomes detectable within 2 to 3 hours of onset and peaks at roughly 12 to 24 hours, then stays elevated for days to weeks .
- The 99th percentile at presentation has a sensitivity of only about 90% overall and about 70% within 3 hours of onset, so serial testing is generally needed.
- In patients with ST elevation, troponin can be below the URL in the first few hours in about 1 in 6, because the infarcted territory is not yet perfused.
- The size of a rise or fall depends on timing, the interval between samples, and the baseline. Assay-specific thresholds exist for diagnostic pathways; they are not the definition of injury.
This is a teaching schematic in multiples of the 99th percentile URL, so it applies to any assay. It is not a pharmacokinetic model of a particular assay, patient, or infarct, and it should not be used to time a real patient's presentation.
Reference figure: zones A to F